Building Performance Dashboard
The Challenge
evolveEA needed a way to visualize and communicate building performance data across their portfolio of sustainable architecture projects.
- Data was scattered across spreadsheets and reports
- Preparing performance summaries for clients was time-intensive
- The firm's climate track record wasn't easily demonstrable in proposals
Existing tools were either too complex or didn't provide the right visualizations for client communication.
My Role
I led this project end-to-end — defining requirements with firm principals, designing the data architecture in Supabase, and building the frontend in React with interactive Mapbox maps. The interface applies the visual identity and brand system I previously developed for evolveEA.
The Solution
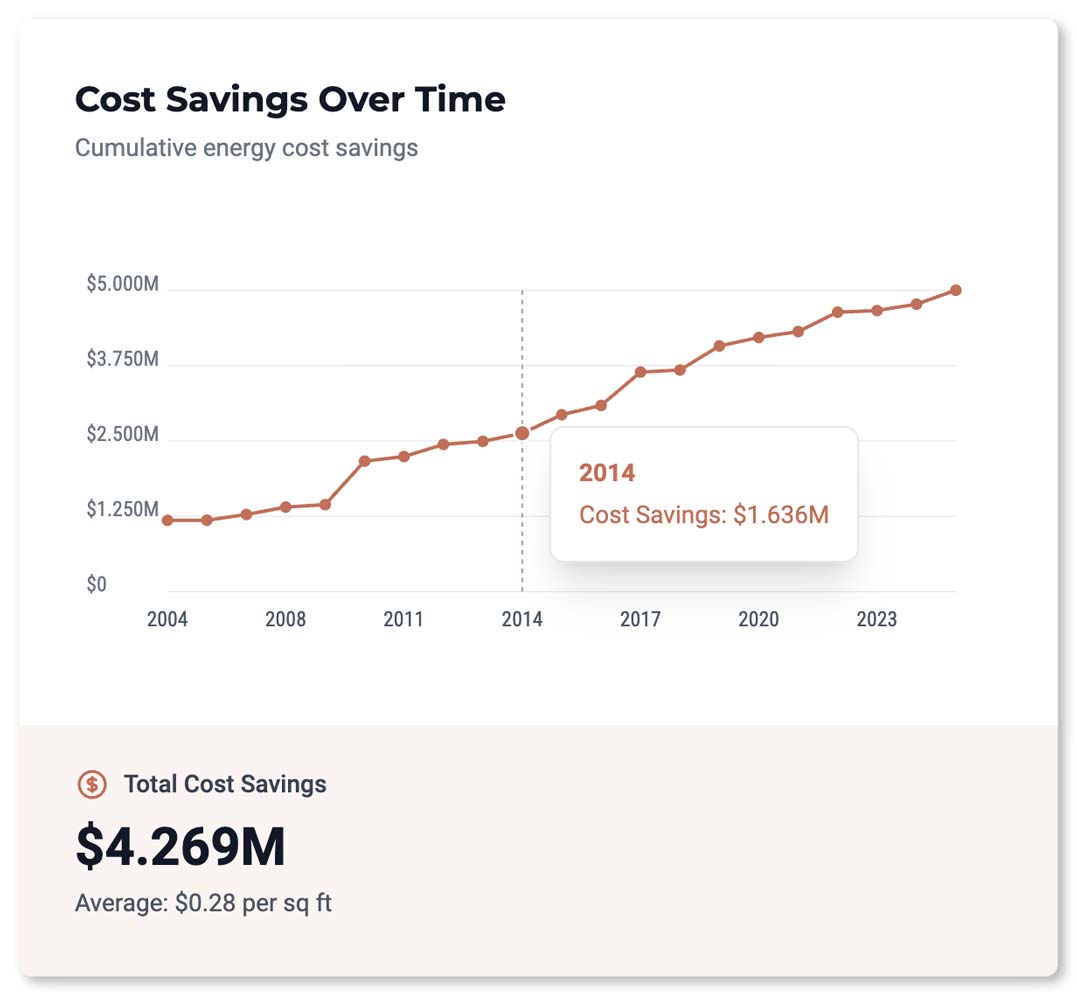
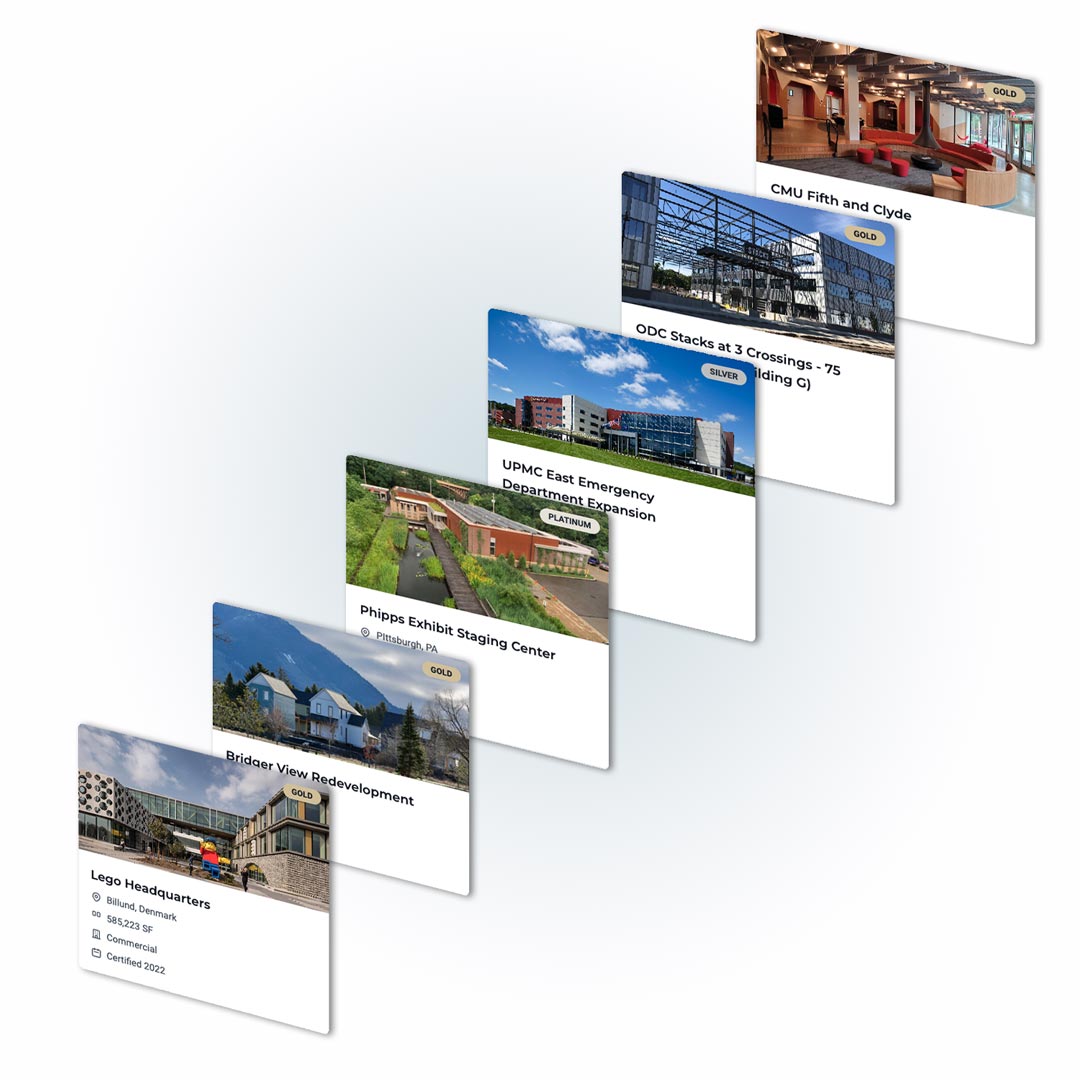
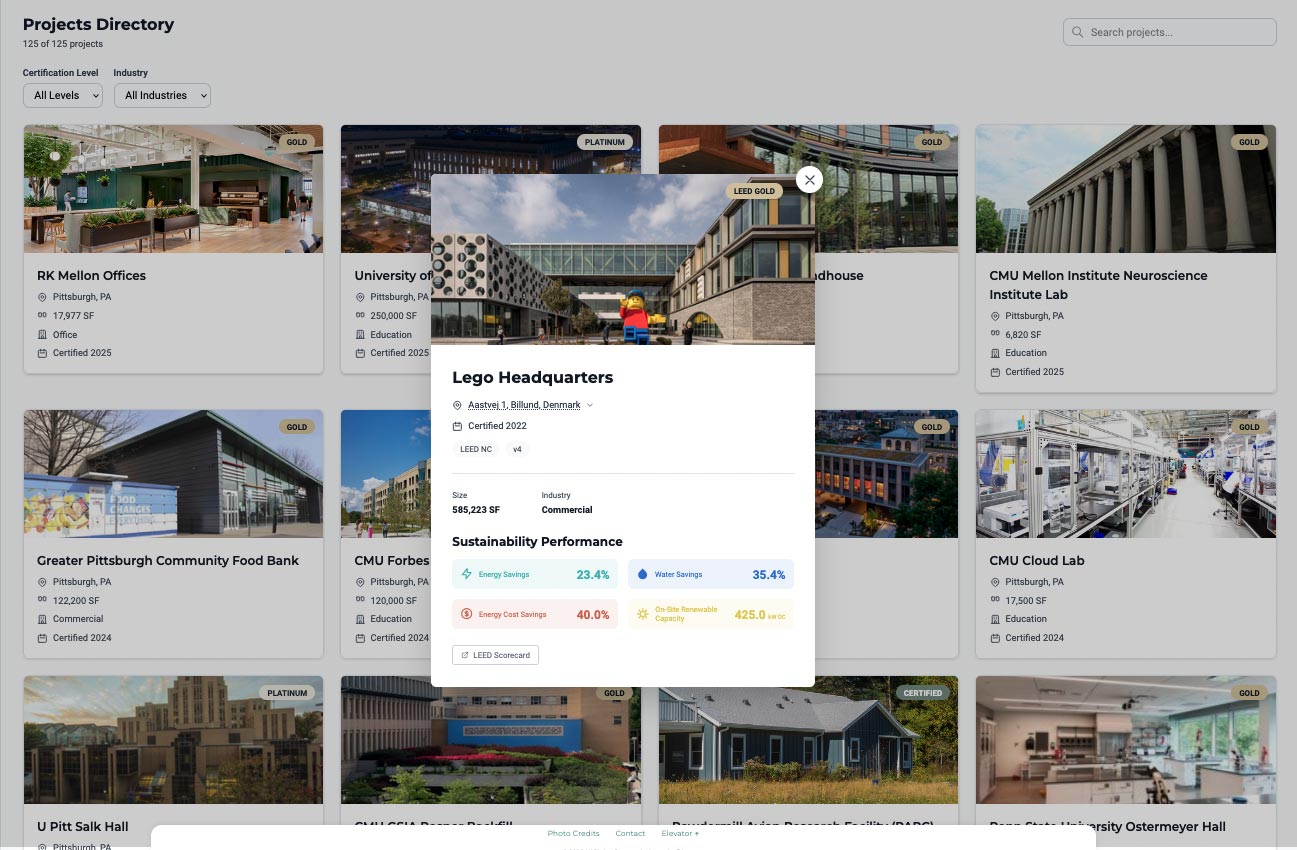
The dashboard visualizes energy use, carbon emissions, and sustainability certifications across multiple buildings. Interactive maps and charts allow users to browse projects, compare performance, and pull data for client presentations.
The platform integrates with the firm's existing project workflow — some data collection is automated through the LEED certification process. The UI system is designed to be replicable as evolveEA expands tracking across their other studios (mobility, climate, planning).
Impact
The tool has become central to evolveEA's client presentations and proposals, making the firm's sustainability track record visible and tangible.